Use case 1 (Philips / TU Delft)
Upgrading PCs and PC components in Azurion systems
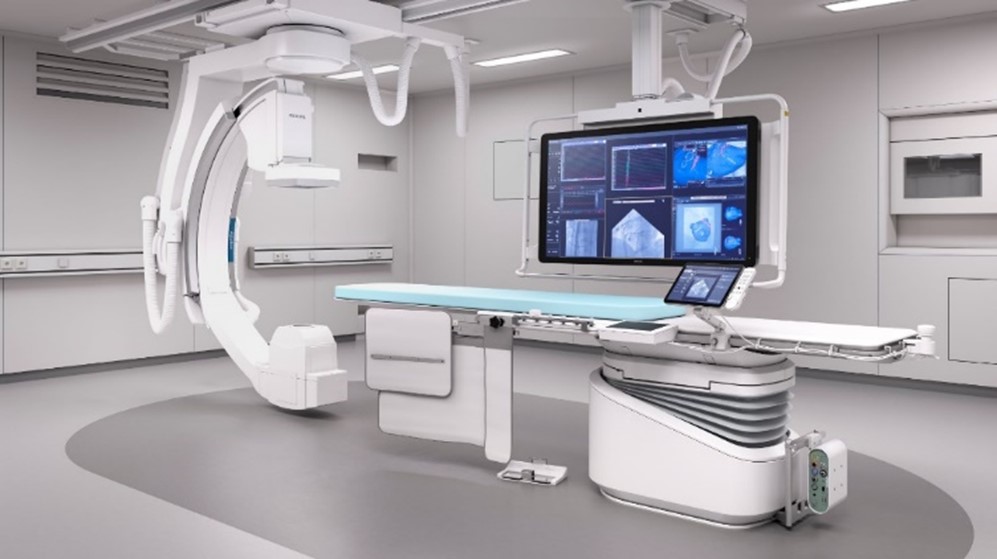
Use case 1 focuses on PC and PC component upgrades in Azurion systems. Azurion is Philips’ latest platform of image guided therapy systems (see Figure 1), which are used to provide X-ray image guidance during minimally invasive therapy, such as coronary procedures, electrophysiology, vascular treatment, oncology (e.g, embolization and ablation) and many more.
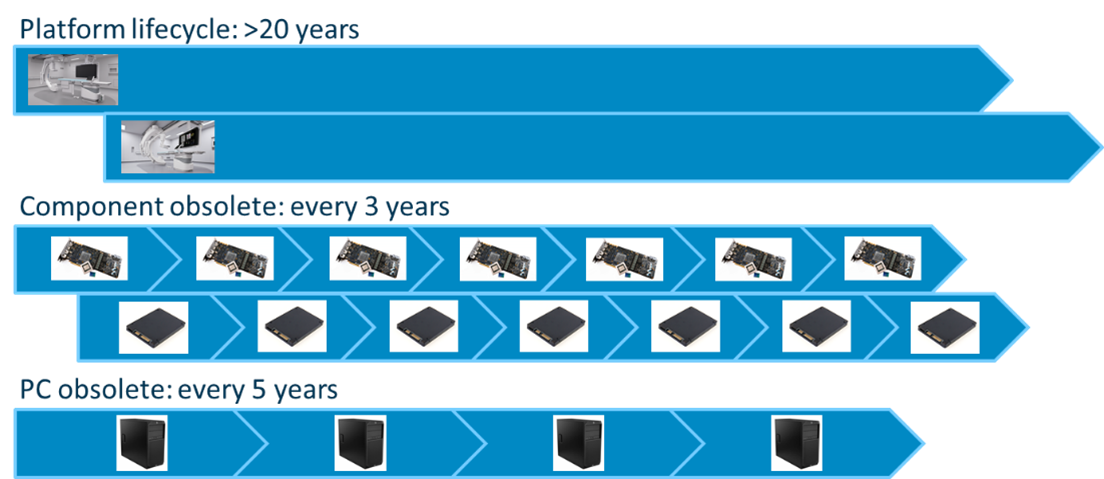
The development trajectory of Azurion systems takes up to 3 years, after which they are in production during a period of typically 5 years. Hospitals across the globe use these systems during a service period of 10 to 14 years. So, the time frame between start of development until the last system has been taken out of service is more than 20 years.
Azurion systems are partially built from modified commercial-off-the-shelf (COTS) components like PC servers. The duration that COTS components are available in the market is typically much shorter than the service lifetime of the Azurion system. In particular, long-life PC components are typically available for a period not longer than 3 years (see Figure 2).
Efficient testing of PCs and PC components
Maintenance of Azurion systems over the service period requires frequent release and verification of new PC servers and PC components to replace obsolete components. The test effort associated with the verification of new PCs and PC components is considerable. For reasons of quality and patient safety, the verification process is very rigorous and governed by a quality management system compliant to medical safety standards. Verification needs to consider the many different system configurations that are currently available in the product catalogue and the configurations that have been released in the past and for which PCs are typically used as spare parts. Without the Vivaldy results, verification of PCs requires testing at system level (as opposed to testing at unit/PC level) because in many cases it is has not been possible to decompose system level requirements into budgets for the individual components (like PCs) that make up the system. Testing system performance on many system configurations requires much more effort and expensive test systems than testing on unit level.
What we want to achieve is greatly simplified system level verification of PCs and PC components through a simple test. This will allow for early risk reduction and partial replacement of system level verification. We plan to replace system level testing of these updates by much more simple component level tests. We will do this by using artificial intelligence (pattern recognition) that maps the relevant PC performance characteristics into system level performance metrics. As a result, the cost of releasing new PCs and PC components is greatly reduced, adding to the flexibility of planning such a release.
Using artificial intelligence instead of system testing
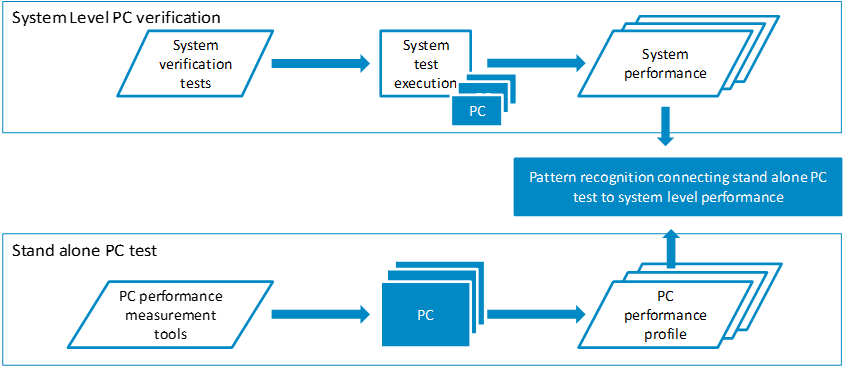
Figure 3 shows how the pattern recognition tools will be trained using relevant PC performance characteristics as input and system level performance metrics as output. In system level verification, we will measure system level performance (like for example image processing latency) in predefined system level test cases (like for example X-ray image processing at a frame rate of 15fps). We will do this for a range of different PCs. These are PCs of different PC generations that we have released in the past. Also we will create PC variation by configuring for example the CPU clock rate or memory sizes in these PCs. In stand-alone PC tests, we characterize the same set of PCs using standard PC test tools that have been configured to measure the performance parameters that are particularly important for our systems. The pattern recognition software is trained using the PC characterization as input and the measured system level performance as expected output.
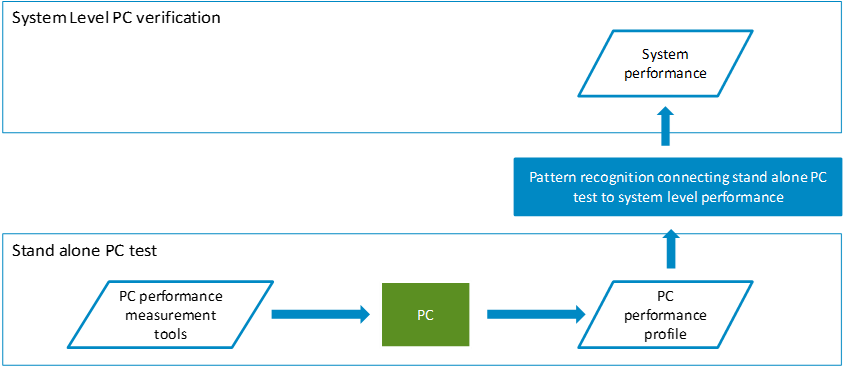
After the pattern recognition algorithm has been trained, the system level tests can be removed (see Figure 4). Instead, the pattern recognition tools estimate the system performance based on stand-alone PC tests. We first characterize the PC under test using the tools and methods also used during training. The PC characterization is input for the trained pattern recognition algorithm that will provide an estimate for the system level performance that will be achieved with this new PC. The video below further explains why it is important to make sure the right PC components are picked and how artificial intelligence helps testing this performance.
AI model for system level X-Ray image latency
System level latency of X-Ray images is the main performance characteristic of the interventional X-Ray system. Long image latency leads to loss of so-called hand-eye coordination for the physician in the sense that movement by the physician of a catheter in the arteries of a patient takes too long to become visible in the X-Ray image. In Vivaldy we have automatically measured the distribution of X-Ray image latency as a function of the configuration of the computer hardware for image processing. Further we have used AI techniques to model the relationship between computer hardware and image latency distribution.
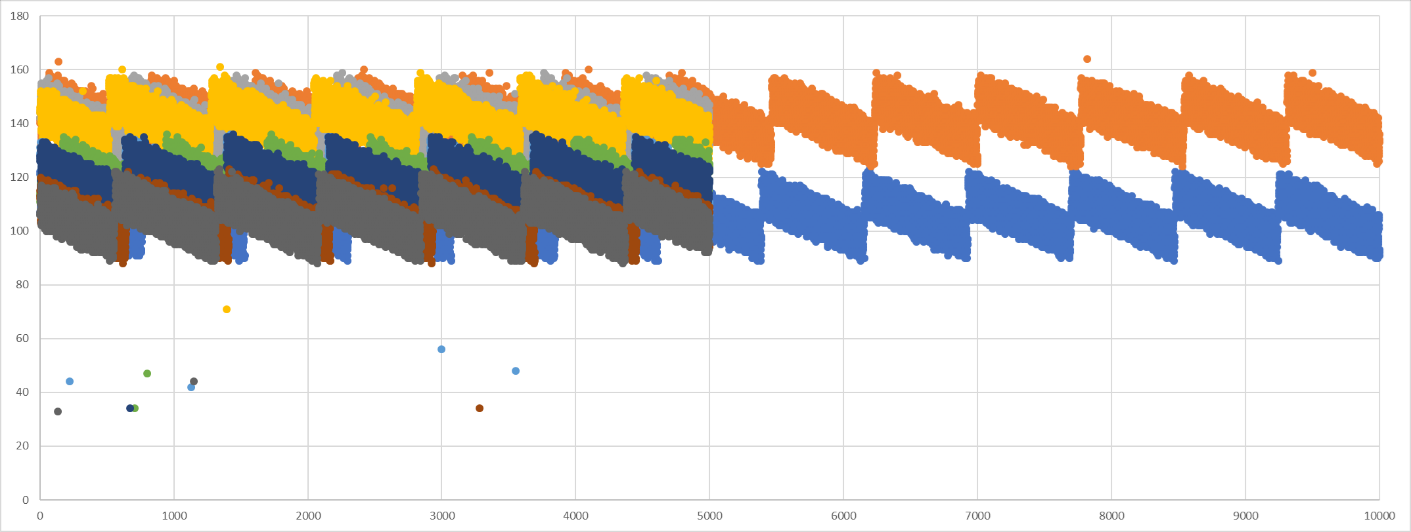
The below figure shows the results of automatic image latency measurements for 6 different configurations of the computer hardware. The computer hardware differs in number of compute cores and memory clock frequency. The saw-tooth pattern that is present in the measurement results is due to buffering of the image data in the end-to-end image chain. Buffering is required when transferring image data between two domains that are controlled by independently running clocks. In case of our system this is creation of the X-Ray image on the one hand and rendering of that same image on the other hand. We have removed the saw-tooth pattern from the measurement data, since this is not of interest for AI modelling.
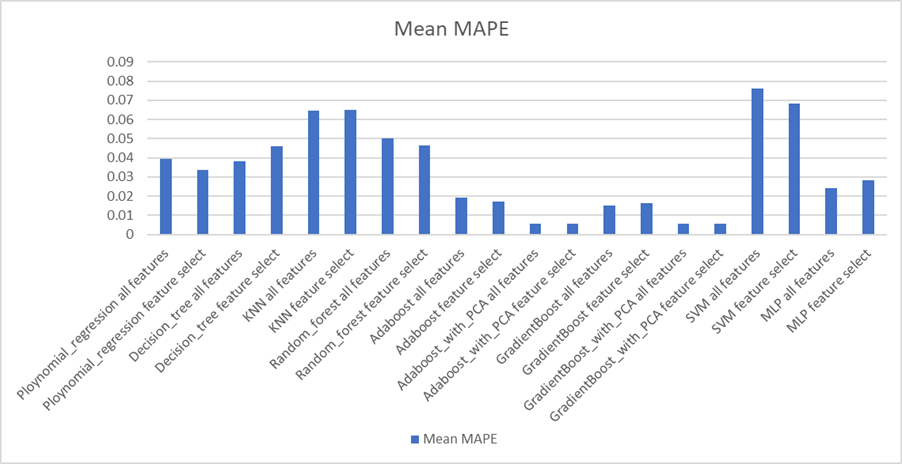
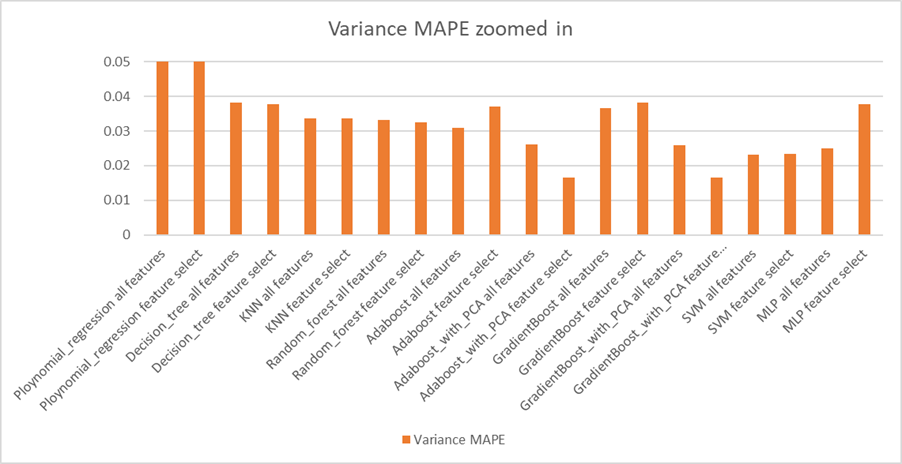
We have used PC benchmarking software PassMark as a tool for characterization of the computer hardware. So, the PassMark result serves as input for the AI algorithms. The diagrams below show the accuracy, measured by mean absolute percentage error (MAPE), of several AI models when assessing the mean and variance of image latency. These results show that the AI algorithms can accurately (relative error < 1% for the best performing algorithms) predict image latency in our interventional X-Ray system.
Business benefit
This technique is relevant at several stages of the development process. In detailed design, we select which PC design we will develop further in the project. Currently the selection at this stage is based on experience and extrapolation of previous results. Until a new PC design has been tested in a system context, there is no certainty that it will meet the system level performance requirements. This leads to a project risk, namely that a PC design that later turns out to fail the system level performance metrics needs to be revised at a late stage in the project. The Vivaldy AI tool mitigates this risk by modelling the system level impact of a PC, so that early in a project with high certainty it can be established that a PC will meet the system level performance metrics. In addition to preventing redesign late in a project, the tool also allows to select a PC design that meets the system level requirements without over dimensioning (at a considerable cost) the PC design.
In product integration, we integrate the PC in a system and measure performance at system level. These system level measurements form a validation of the AI tool. The number of system configurations (current and past) is however so large that it is impossible to test all of them, and all those system configurations are not even available for testing. Traditional testing in this phase is risk based, where only certain specific configurations are tested. The AI tool plays an important role here to ensure verification of system level performance for the complete set of system configuration that cannot be tested in the traditional way.
In design verification, we formally verify that the design meets the requirements. The verification time is limited and typically focused on the mean values of system level performance metrics. The Vivaldy AI tool allows to verify also the distribution of performance metrics, like for example the ratio of outliers that occur only very infrequently and can only be measured after very long test time. The AI tool establishes the relationship between the mean value of a performance metric and its distribution.